App Introduction
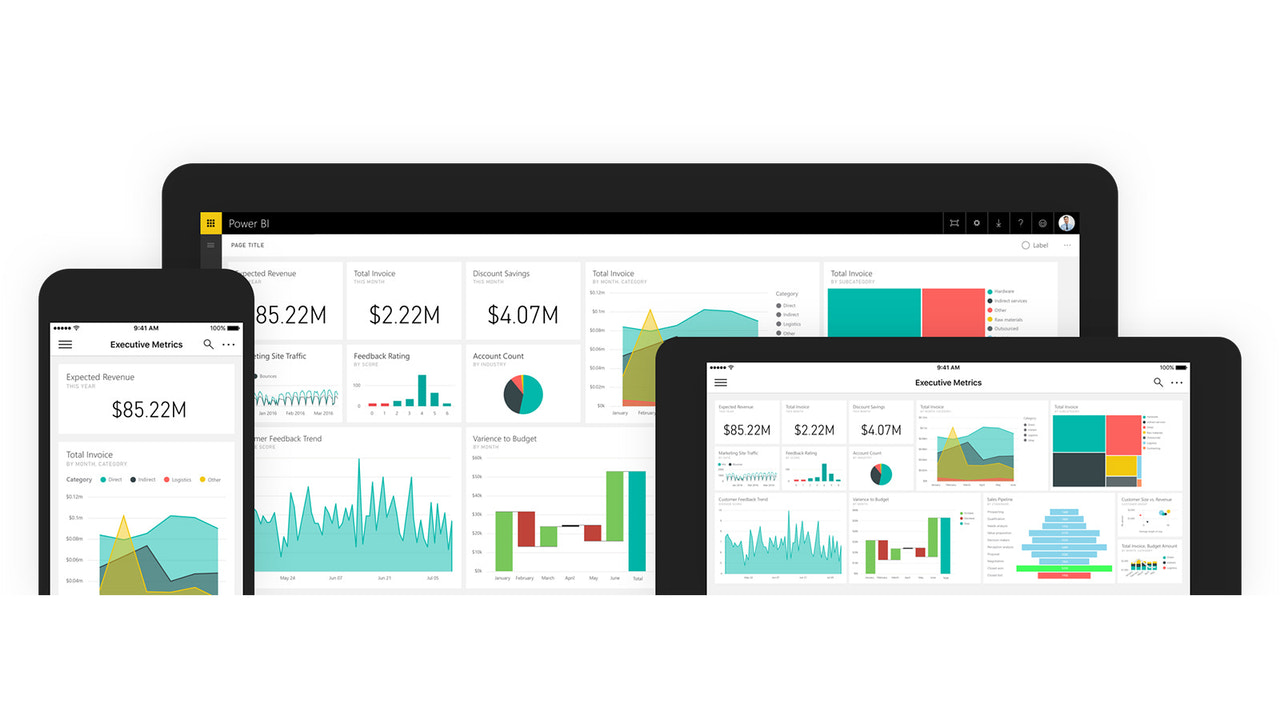
Power BI transforms your data into rich visualizations that you can organize however you like. Across all industries, organizations recognize the power and potential of fast, effective analytics and data visualization tools. Business Intelligence (BI) is an essential tool for uncovering valuable insights and maintaining a competitive edge. To succeed, companies need a modern, easy-to-use BI platform that is not only an industry leader but also has a vision to meet future needs.
Core Functionality
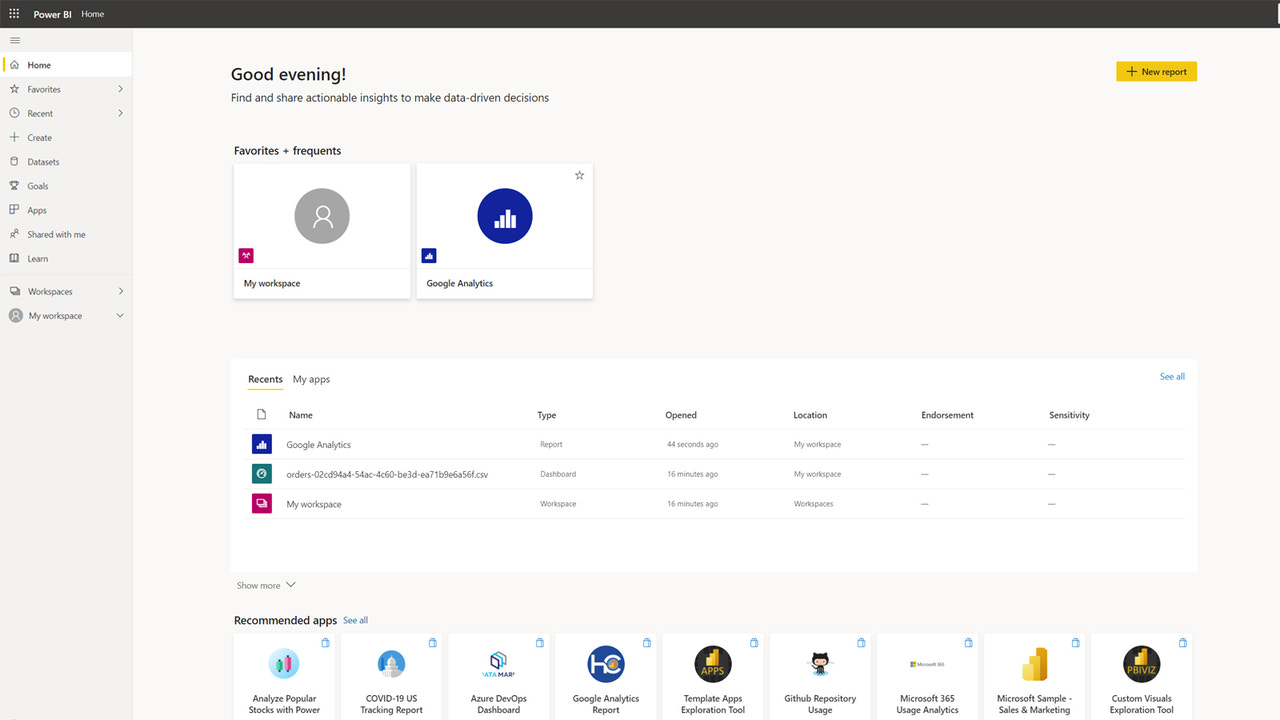
- Create stunning interactive reports.
- Daily automatic updates.
- Build intuitive dashboards.
Merchant-Friendly
- Data-driven Merchants
- Growth-oriented E-commerce
- Independent Station Sellers
Basic Information
- Developer:Image Optimizer
- Address:20 Ocean Street, Bondi, NSW, 2026, AU
- Price: Free / Free plan
- Rating:3 / 5
- Comment Count:6 comment
- Release Date:2016-9-23
- Supported languages:English
- Compatible products:Shopify
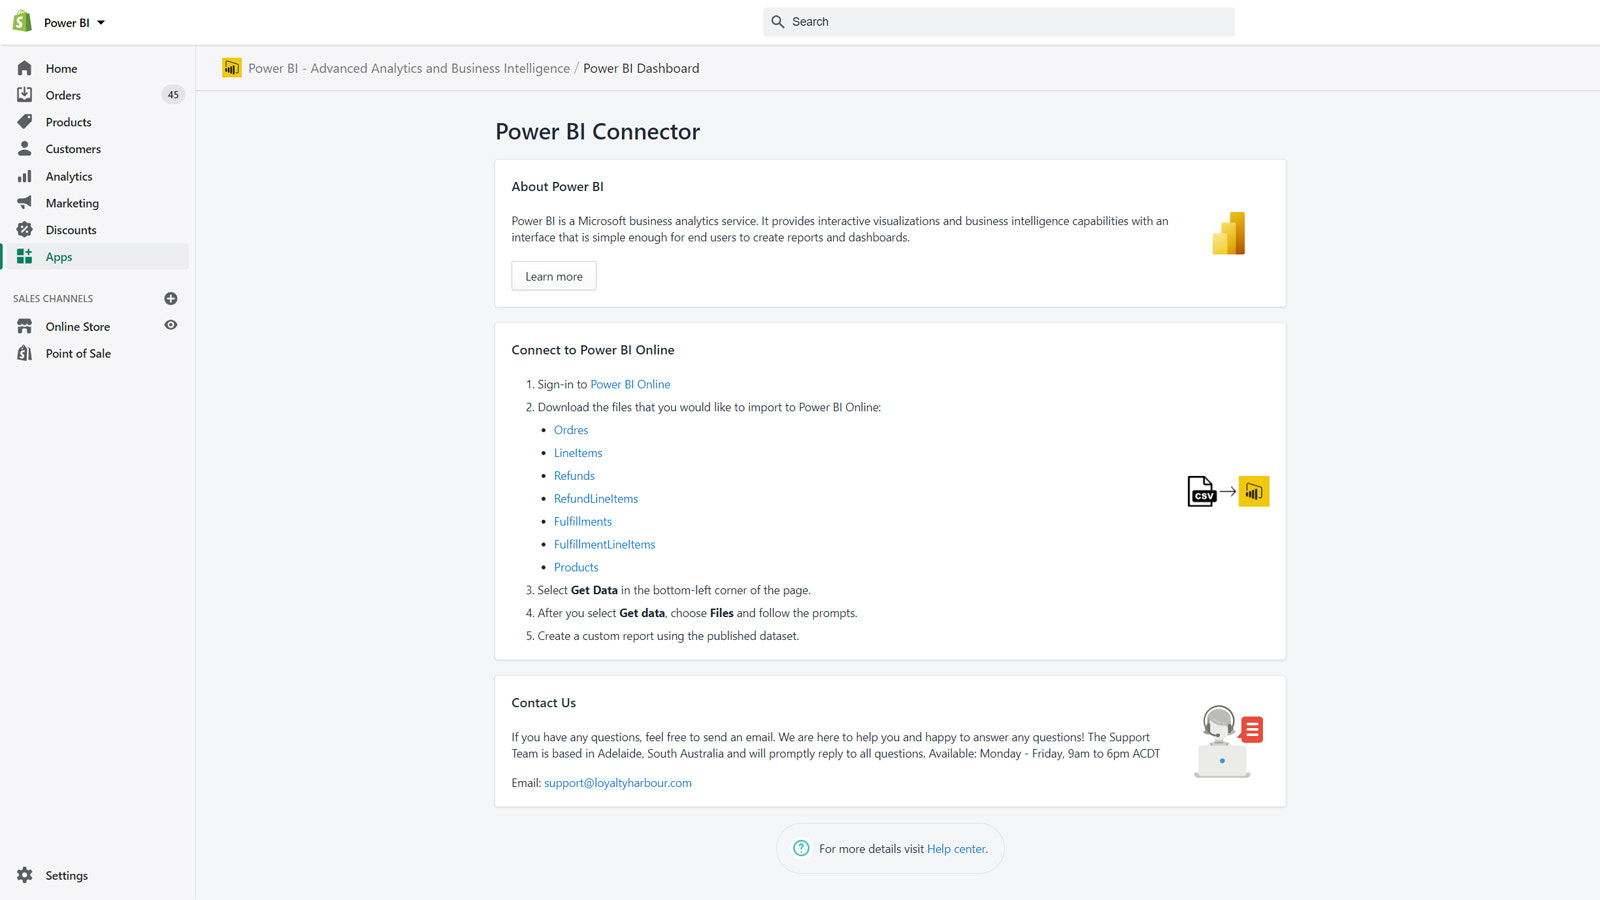
Application Screenshot


Price Plan
Pro
$49
- Up to 100 orders per month
- Daily updates
- Email support
Plus
$99
- Up to 500 orders per month
- Daily updates
- Email support
Enterprise
$299
- Monthly Unlimited Orders
- Daily Updates
- Email Support
User Location & Comments
User Location
Comments
Shopify API Used
- POST /admin/api/reports.json
- PUT /admin/api/reports/{report_id}.json
- GET /admin/api/reports.json
Permission:write_reports,read_reports,manage_analytics
- POST /admin/api/reports/{report_id}/schedule.json
- PUT /admin/api/reports/{report_id}/schedule.json
- GET /admin/api/reports/{report_id}/schedule.json
Permission:write_reports,read_reports,manage_analytics
- POST /admin/api/dashboards.json
- PUT /admin/api/dashboards/{dashboard_id}.json
- GET /admin/api/dashboards.json
Permission:write_dashboards,read_dashboards,manage_analytics