App Introduction
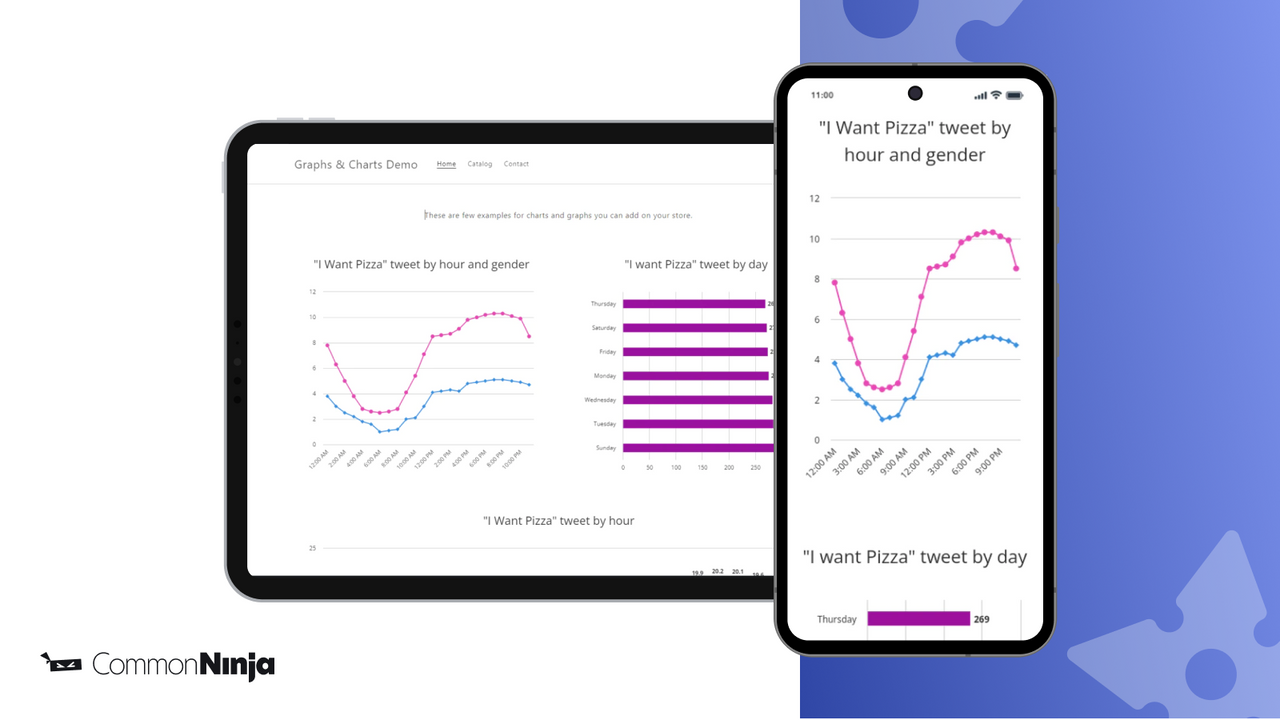
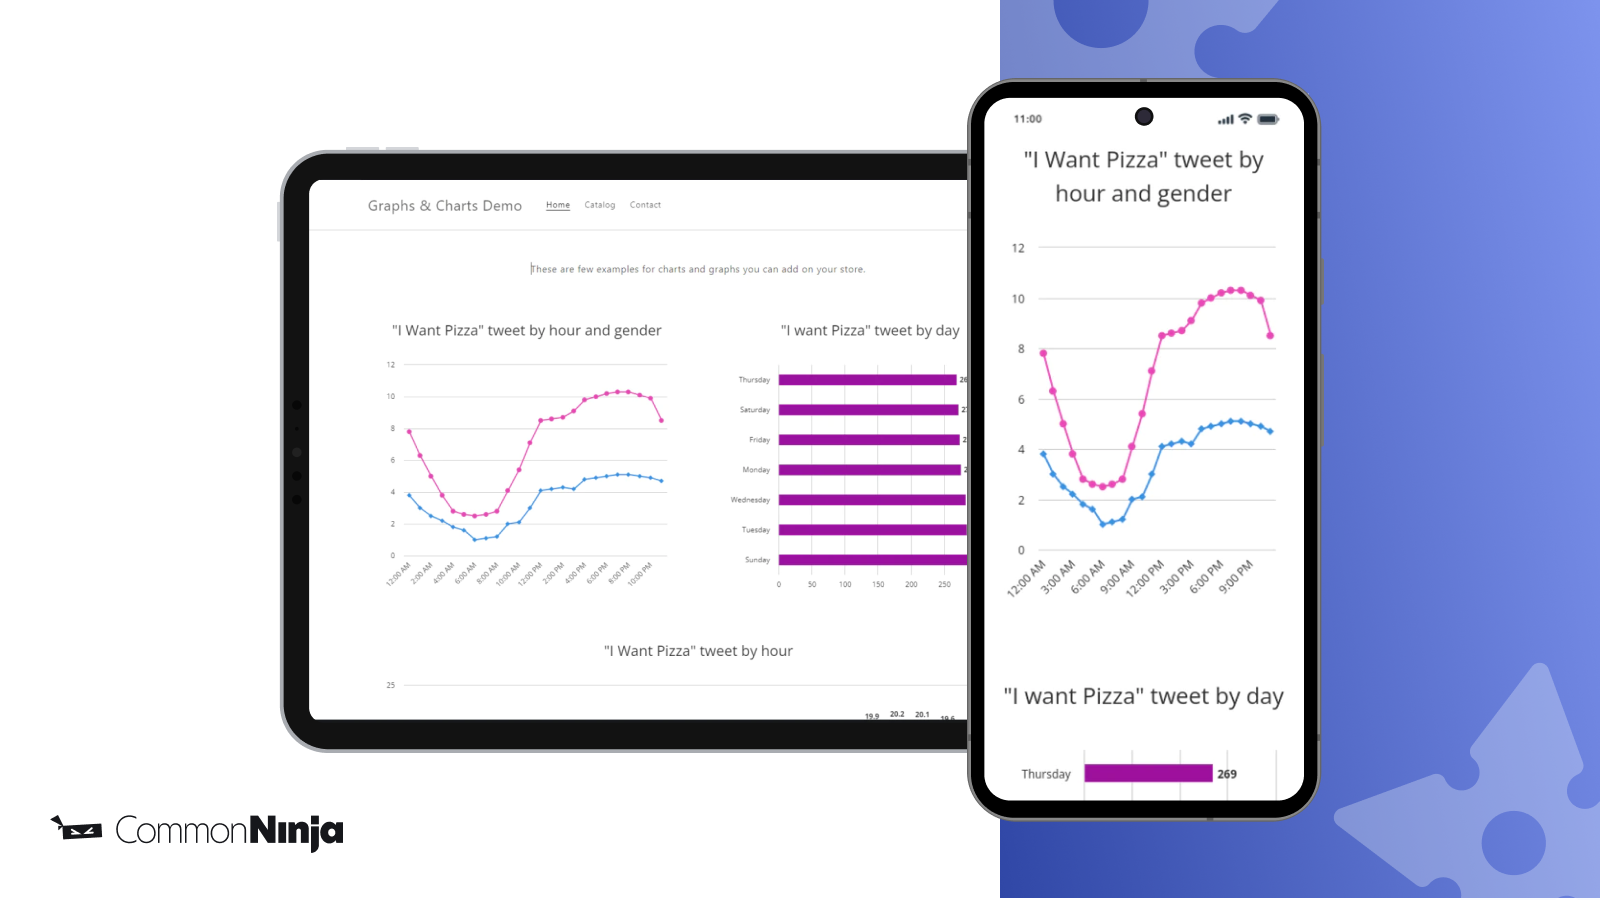
Turn your store’s data into sales with stunning interactive charts that drive conversions. Transform your store data into visual assets that fuel sales. Create over 20 chart types—from bar graphs to interactive pie charts—and place them anywhere on your store to grab attention and keep visitors engaged. Import via CSV or Google Sheets for instant updates, or connect real-time data sources for automatic refreshes. Customize colors, fonts, and layouts to perfectly match your brand. Ideal for product comparisons, promotion tracking, and showcasing customer reviews. Fully responsive, lightning-fast, and built to convert visitors.
Core Functionality
- Visualize store data with 20+ chart types to engage visitors and boost sales.
- Automatically sync from CSV or Google Sheets to keep charts up-to-date.
- Launch stunning charts in 2 minutes using professional templates.
- Full brand control with custom fonts, colors, and chart layouts.
- Embed charts anywhere—products, blogs, or landing pages.
Merchant-Friendly
- Data-driven Merchants
- Visual Marketing Merchants
- Multi-page Operators
- Efficient Sync Merchants
- Branded Operators
Basic Information
- Developer:Common Ninja
- Address:Hanofar 7, Netanya, 4256557, IL
- Price: Free / Free plan
- Rating:5 / 5
- Comment Count:2 comment
- Release Date:2021-8-12
- Supported languages:English
- Compatible products:Shopify
Application Screenshot


Price Plan
Free Plan
- 2 charts
- 1 series
- 10 rows of data
- 3 chart types
- custom fonts
Basic Plan
- 10 Charts
- 3 Series
- 30 Rows of Data
- 6 Chart Types
- Custom Design
- Remove Ads
Pro Plan
- 200 Charts
- 10 Series
- 500 Rows of Data
- 13 Chart Types
- CSV Import
- Automatic Data Refresh
- Remove Ads
Business Plan
- 1,000 Charts
- 50 Series
- 5,000 Rows of Data
- 20 Chart Types
- Dynamic Data from URL
- CSV Import
- Remove Ads
User Location & Comments
User Location
Comments
Shopify API Used
- POST /admin/api/chart.json
- GET /admin/api/chart.json
- PUT /admin/api/chart/{id}.json
Permission:write_themes,read_analytics,manage_online_store
- POST /admin/api/chart/sync.csv
- GET /admin/api/chart/sync/status.json
- PUT /admin/api/chart/{id}/sync.csv
Permission:write_files,read_analytics,manage_charts
- POST /admin/api/chart/template.json
- GET /admin/api/chart/template.json
- PUT /admin/api/chart/{id}/template.json
Permission:write_themes,read_analytics,manage_charts
- POST /admin/api/chart/style.json
- GET /admin/api/chart/{id}/style.json
- PUT /admin/api/chart/{id}/style.json
Permission:write_themes,manage_charts,read_analytics
- POST /admin/api/chart/embed.json
- GET /admin/api/chart/{id}/embed.json
- PUT /admin/api/chart/{id}/embed.json
Permission:write_themes,manage_pages,manage_products